Report figure
Present existing artwork with a useful caption and access to its full-size source.
On this page
Code
import type { ReactElement } from "react";
import { ReportFigure } from "@bosunkit/components/report-figure";
export const description: string = "Existing chart artwork with a caption and a link to the full-size image.";
export default function CaptionedFigure(): ReactElement {
  return (
    <ReportFigure
      src="/changelog/report-charts-after.png"
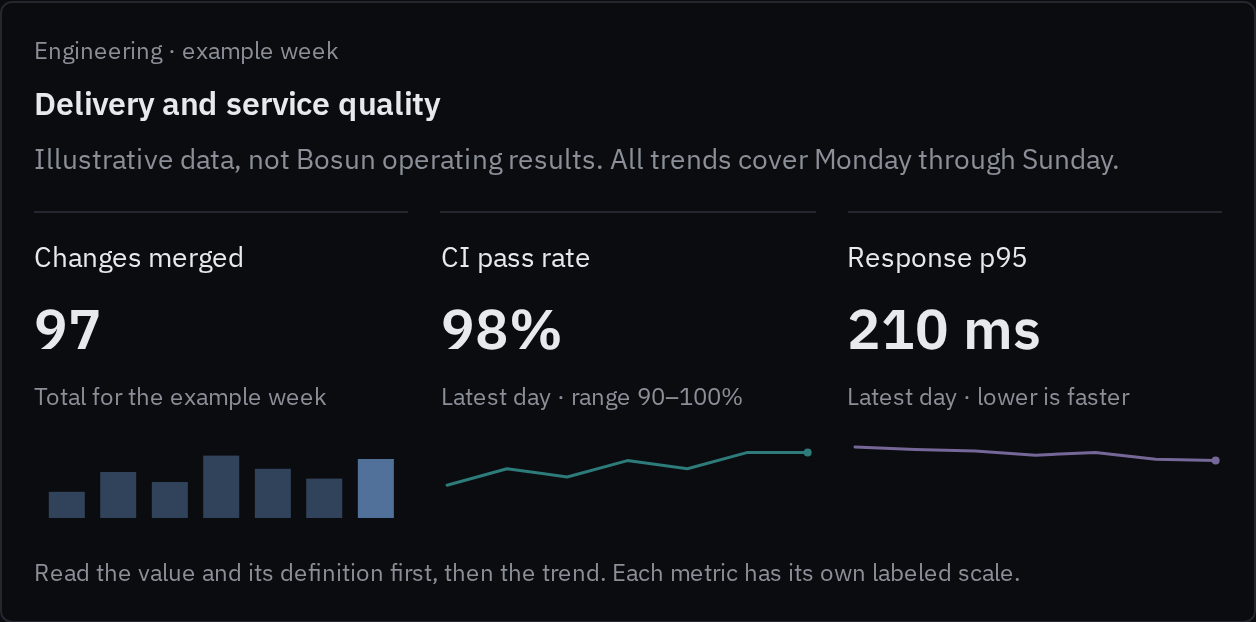
      caption="Illustrative report charts from the data-visualization guide; these are not measured Bosun results."
    />
  );
}
Use
Use this component for existing SVG or raster artwork. Use Mermaid for editable relationships and chart components
for interactive observations. Supply a verified src and a meaningful caption; the image loads lazily.
The source link opens in a separate tab. Image text can be too small at phone widths, so preserve essential findings in the surrounding report. A caption does not replace a detailed description of a complex drawing.
Composition
Code
import type { ReactElement } from "react";
import { ReportFigure } from "@bosunkit/components/report-figure";
export const description: string = "Existing chart artwork with a caption and a link to the full-size image.";
export default function CaptionedFigure(): ReactElement {
  return (
    <ReportFigure
      src="/changelog/report-charts-after.png"
      caption="Illustrative report charts from the data-visualization guide; these are not measured Bosun results."
    />
  );
}
Source, explanation and export
Use a stable source asset that the reader is authorized to access. State whether the artwork is illustrative, measured output or a screenshot of a particular revision. A screenshot retains its captured theme and does not inherit the report palette. Keep the figure's important conclusion in selectable prose nearby.
Check the image at its fitted width, at the full-size destination and in print. Long labels may require a wider figure area or a separate detail image; enlarging the entire documentation page can obstruct navigation. Verify that a Markdown export preserves the image link and caption and that an offline deliverable includes the asset.
Props
| Prop | Type | Default | Description |
|---|---|---|---|
| srcrequired | string | – | Local artwork or another verified image URL. |
| captionrequired | string | – | Meaningful caption; describe complex relationships in nearby prose as well. |
Identify the source, audience and measurement boundary.
A polished report needs supported claims and explicit uncertainty.
Related
- Mermaid: editable flowcharts and sequence diagrams.
- Chart panel: interactive chart framing and evidence.
- Report blocks: supporting summaries and explanations.